TimeWeaver combines static path analysis with timing measurements to provide worst-case execution time estimates.
The tool estimates the worst-case execution time (WCET) of tasks based on the execution time of trace segments obtained from real-time instruction-level tracing. The computed time bounds are valuable for soft real-time systems and provide feedback for optimizing worst-case performance.
Your benefits
- The hybrid approach works for a wide range of modern high-performance processors that are not statically predictable anymore, not even by a most sophisticated tool such as aiT. This includes multi-core processors where inter-core interferences cannot be prevented or controlled in a satisfactory way, or where the available documentation is insufficient to build a static timing model.
- TimeWeaver is non-intrusive. It needs no code instrumentation that distorts timing measurements. It uses the embedded trace units of modern embedded processors (Nexus 5001, CoreSight ETM, etc.) to observe program flow. Interference effects included in the traces, such as access delays to shared resources, are taken into account.
Workflow
TimeWeaver takes as input:
- a binary executable
- execution traces,
e.g. BHM traces compliant to the IEEE-ISTO 5001 standard - optional user annotations,
e.g. on loop bounds, in the same format as other AbsInt analyzers such as aiT, TimingProfiler, or StackAnalyzer
TimeWeaver then provides a safe upper bound of the length of the longest execution path, based on the local time measurements in the traces.
Features
The analysis results reported by TimeWeaver include:
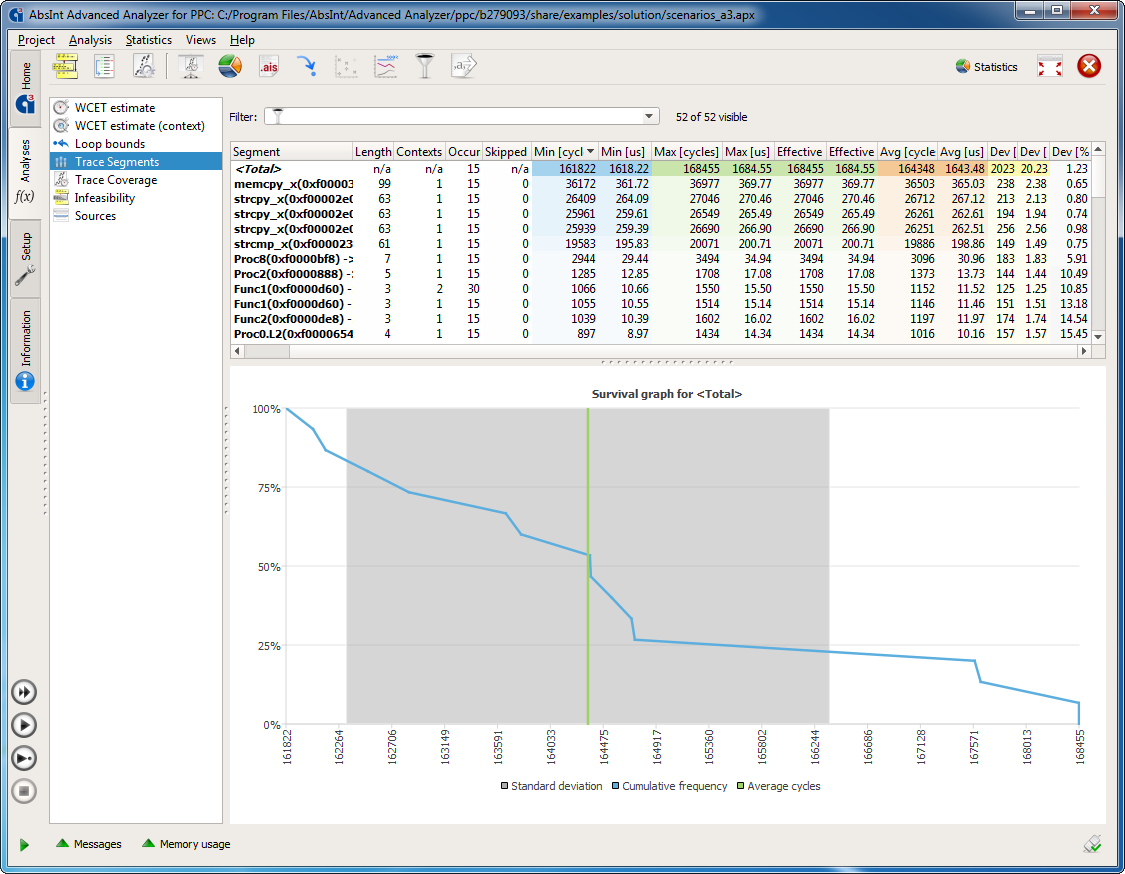
- global end-to-end time, based on the maximum observed trace segment times combined to an overall bound
- end-to-end bounds for specific functions, depending on trace points
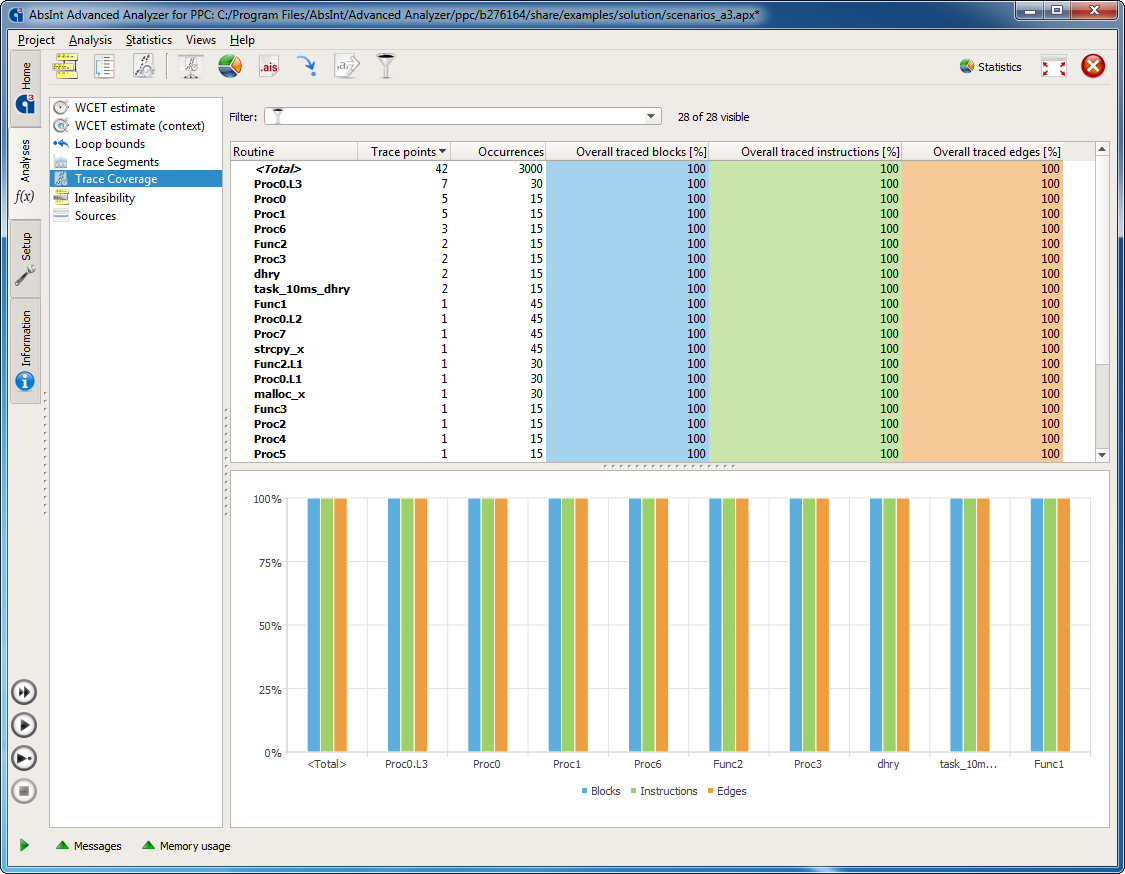
- coverage of the control-flow graph by the input traces
- maximum possible and maximum observed iteration counts for loops
- time variance of each code segment over all traces
TimeWeaver offers the same powerful user interface you are used to from working with other AbsInt tools, with fully integrated graphical and textual viewers for control flow, analysis results, source code, assembly code, and configuration files. You can:
- interactively explore analysis results
- save and restore analysis scenarios
- export customizable reports for documentation and certification purposes
- start all analyses from the same GUI and handle all the tools with the same look and feel
Supported architectures and trace formats

- All PowerPC boards able to emit Nexus program trace messages (IEEE-ISTO 5001, class 2 or higher), for example:
- PowerPC QorIQ P204x/P30xx/P40xx/P50xx (e500mc core)
- PowerPC QorIQ T series (e5500/e6500 core)
- PowerPC Qorivva line MPC55xx/MPC56xx/MPC57xx (e200 core)
- ARM using cycle-accurate ETM traces, for example:

- Cortex-A53
- Cortex-R5F
- TriCore:

- AUDO family (e.g. TC1796)
- AURIX (e.g. TC275)
- AURIX 2nd GEN (e.g. TC397)
- All Renesas RH850 boards equipped with a Nexus or AURORA trace interface, for example:

- RH850/C1H
- RH850/F1KM-S1
- All Motorola ColdFire boards that provide real-time trace support (e.g. MCF5307).

Free trial
Free trial versions are now available for PowerPC, ARM, TriCore, and RH850.
Support for further architectures is planned, and can be requested.
Please contact info@absint.com with any questions.
PDF downloads
- Product flyer
- Factsheets for: PowerPC, ARM, TriCore, RH850

